Instructions on how to configure Cisco switch using Ubuntu:
Order:
Install minicom
Security
Banner
Host Name
Vlan IP
Default Gateway
Interface Setup
-------
Install & Configure Mini-Com to connect to switch.
Install mimicom
apt-get install minicom
identify serial com
dmesg | grep tty
start minicom configuration
sudo minicom -s
Default Setup:
serial port setup
change serial device ttyS0
change port speed to "C" 9600
Hardware flow control "no"
ESC to exit minicom
save setup as dfl
exit
---------------------------------------------------
https://www.youtube.com/watch?v=r88HmwQGd0s
To reset/ recover pwd:
power cycle switch while holding down mode button
this will bring up >
switch:
then
apply "flash init" command
switch:flash_init
then
load_helper
type dir at prompt
type "dir flash:" at prompt with the colon
type rename flash:config.text flash:config.old
#if the above fails do
switch: delete config.text
to confirm changes
type dir flash:
you will see config extension has changed to config.old
reboot switcht
type boot
select "no" on entering config dialog
type "enable" at prompt
the system will show
switch#
type "configure terminal"
system will return request for configuration commands.
Done!
------------------------------------------------------
Now to configure the switch:
http://www.youtube.com/watch?v=n_3CHv9bXdc
Secure the switch and console port:
Note:
After typing "configure terminal" the prompt
will be:
Switch(config)#
To change pwd type following at prompt:
"enable secret" (pwd goes here no brackets)
--------------------------------------------------------
To secure console port:
"line console 0"
The prompt will change to - Switch(config-line)
ie. Switch(config-line)#
Now we set pwd for console
password (pwd)
then type "login"
nothing will show at prompt
in case commands get broken up during input this will paste
them into next prompt
type "logging synchronous"
exect time out to 30 min 0 secs
type exec-timeout 30 0
do a ctrl-Z
the prompt will now be: Switch#
Now we configure vty ports:
type "configure terminal"
configure ports zero-four
type "line vty 0 4"
set synchronous logging and pwd (as done previously) @ prmpt
type:
password (pwd)
then
synchronous logging
type logging synchronous
this will return session to previous mode.
type exit
do ctrl Z if not at Switch# prmpt
to see what's written to RAM
type show-running config
observer enable secret is md5 hashed pwd
but there is a message stating no service password-encryption
enable srvc pwd encryption:
@prompt type:
"configure terminal"
then
"service password-encryption"
ctrl Z
show running-config
service-password encryption will be enabled now.
**Security for device is now enabled
Save progress by typing at prompt:
"copy running-config startup-config"
-----------------------------------------------------------
Banner & Host Name:
enter global config mode:
Switch# "configure-terminal"
Switch# "banner motd" [ (message of the day)
then
*************************************
UNAUTHORIZED ACCESS IS PROHIBITED!!!
**************************************[
- the bracket "[" is necessary to initiate and terminate the
message entry. (it will not show in the msg)
change hostname
Switch(config)#HOSTname sw1
prmpt changes to
sw1(config)
do ctrl Z
type "copy running-config startup-config"
[OK] will be shown
DONE!
-------------------------------------------------------------
- VLAN CONFIG:
this will show port configuration
sw1#show ip interface brief
enter config mode
"configure terminal"
tell which interface to config
type "interface vlan1"
config interface ip and subnet
type #ip address 192.168.1.X 255.255.255.0
turn on interface
type "no shutdown"
ctlZ
confirm status UP
"show ip interface brief"
-------------
-Default GW
sw1#configure terminal
sw1#(config)
so
sw1(config)#ip default-gateway 192.168.1.1
ctl Z
type "copy running-config startup-config"
-------------
Interface setup - configure fast ethernet ports:
sw1>configure terminal
for a single port:
sw1#>interface fastEthernet 0/1
for the entire range:
interface range fastEthernet 0/1 -24
-------------
Save changes:
copy running-config startup-config
Done!
Wednesday, November 26, 2014
Thursday, November 6, 2014
W3af install on Ubuntu 14.04
Running apt-get install didn't work so here is what I did.
sudo apt-get install libssl-dev libsqlite3-dev libyaml-dev
Apparently the python version also needs modules:
clamd github git.util pybloomfilter esmre phply nltk chardet pdfminer concurrent.futures OpenSSL lxml scapy.config guess_language cluster msgpack ntlm Halberd darts.lib.utils xdot
After running the above follow the instructions and install clamav.
After installing any missing operating system packages, use pip to install the remaining modules:
sudo pip install clamd==1.0.1 PyGithub==1.21.0 GitPython==0.3.2.RC1 pybloomfiltermmap==0.3.11 esmre==0.3.1 phply==0.9.1 nltk==2.0.4 chardet==2.1.1 pdfminer==20110515 futures==2.1.5 pyOpenSSL==0.13.1 lxml==2.3.2 scapy-real==2.2.0-dev guess-language==0.2 cluster==1.1.1b3 msgpack-python==0.2.4 python-ntlm==1.0.1 halberd==0.2.4 darts.util.lru==0.5 xdot==0.6
Install & Launch:
sudo apt-get install gitInstall Python installer (pip) sudo apt-get install python-pip python-dev build-essentialsudo pip install --upgrade pipsudo pip install --upgrade virtualenvIf you don't have scapy on the system:apt-get install scapy - install necessary libs. Install these dependencies:
sudo apt-get install python-svn
sudo pip install pybloomfiltermmap
sudo apt-get install graphvizsudo apt-get install libgraphviz-devsudo apt-get install libgraphvizsudo apt-get install python-gtk2sudo apt-get install python-gtksourceview2sudo apt-get install python-scapyAll this needs to be installed as well. sudo apt-get install python2.7 sudo pip install fpconst
sudo pip install nltk
sudo pip install SOAPpy
sudo pip install pyPdf
sudo apt-get install libxml2-dev
sudo apt-get install libxslt-dev
sudo pip install lxml
sudo pip install pyopensslMore libs:
sudo apt-get install libssl-dev libsqlite3-dev libyaml-dev
Apparently the python version also needs modules:
clamd github git.util pybloomfilter esmre phply nltk chardet pdfminer concurrent.futures OpenSSL lxml scapy.config guess_language cluster msgpack ntlm Halberd darts.lib.utils xdot
After running the above follow the instructions and install clamav.
After installing any missing operating system packages, use pip to install the remaining modules:
sudo pip install clamd==1.0.1 PyGithub==1.21.0 GitPython==0.3.2.RC1 pybloomfiltermmap==0.3.11 esmre==0.3.1 phply==0.9.1 nltk==2.0.4 chardet==2.1.1 pdfminer==20110515 futures==2.1.5 pyOpenSSL==0.13.1 lxml==2.3.2 scapy-real==2.2.0-dev guess-language==0.2 cluster==1.1.1b3 msgpack-python==0.2.4 python-ntlm==1.0.1 halberd==0.2.4 darts.util.lru==0.5 xdot==0.6
Install & Launch:
git clone https://github.com/andresriancho/w3af.git

$ cd w3af

$ ./w3af_guiMonday, November 3, 2014
FireFox as hacking platform.
This collection of addons is useful for pen testing engagements.
Information Gathering:Whois & geo-location :
- ShowIP - Shows IP of current page in status bar. Allows queriying custom services by IP and hostname by rt and lft click of mouse.
- Shazou - (shazoo) japanese for mapping. allows geolocation discovery
- HostIP.info Geolocation - Displays Geolocation using hostip.infodata data
- ActiveWhois - gets deatails about site ownwer and it's host server.
- Bibirmer Toolbar - Some tweaking necessary. Includes Whois, DNS Report, Geolocation, Traceroute, Ping.
Enumeration/ Fingerprinting:
- Header Spy - shows http headers on statusbar
- Header Monitor - displays responses of top level documents returned by web server
Social Engineering:
People Search & Public Record - perform public searches record lookups with this addon.
Googling and Spidering:
- Advanced dork - used to spider or scan for hidden files on a site using google's advanced operators.
- Spider Zilla - mirror utility based on httrack from httrack.com
- Vew Dependencies - adds tab that lists all files which were loade3d to show current page. Good for spidering.
Security Assesment / Code auditing:
Editors:
- JSView - Allows view of open source on any web page.
- Cert Viewer Plus - adds options to view certificates
- Firebug - edit and debug css, html and javascript on the fly.
- XML Developer Toolbar - allows XML developers' tools from browser.
Headers Manipulation:
- Header Monitor - displays http response header of top level document returned by web servers.
- RefControl - Control what gets sent as the http referrer on a per-site basis.
- User Agent Switcher - allows switching of user agent with button.
Cookies and Manipulation:
- Allcookies - Dumps ALL cookies to firefox standard cookies.txt , Session cookies included.
- Cookie Swap - enables swapping of sets of profiles of cookies while browsing.
- httpOnly - Adds httpOnly cookie support to Firefox by encrypting cookies marked as httpOnly on the browser side.
- Add n Edit Cookies - allows editing of sessions and saved cookies.
Security Auditing:
- HackBar - enables testing for SQLinjections, XSS holes and site security. Helps developers secure their code.
- Tamper Data - view and modidy http/https headers and post parameters
- Chickenfoot - allows code manipulation on the fly
- Proxy/ Web Utils
- FoxyProxy - replaces ff's proxy management. offers more features than Switch Proxy, ProxyButton, QuickProxy, xyzroxy. ProxyTex etc
- SwitchProxy - anonymizer and allows changing proxy configurations
- POW (Plain Old WebServer) - Uses SJS (Server-side JavaScript to run a server inside browser. Includes security features to pwd protect user's site. Used to distribute files, create wikis, chat rooms and search engines using SJS.
Malware Scanner:
- QArchive.org web files checker - allows checking webfiles for malware
- Dr.Web anti-virus checker - checks files and pages pre download
- ClamWIN Antivirus Glue for Firefox - scans downloaded files
Anti Spoof
refspoof: overide URL referrer from sites
Misc:
Hacking for fun
- Greasemonkey: customize web pages with java script
- Fire Encrypter: provides encryption/ decryption and hashing from ff.
Wifi Pentesting basics - Kali
Wifi pentesting:
There are a number of ways execute the following. I like to have a lot of this scripted. Scripted tools are out there as well,Pwnstar is one of my favorites, look into it!!
Crack A WPA Wi-Fi Password With Aircrack
Kali Linux comes with a whole suite of apps for cracking Wi-Fi networks, including Aircrack and Reaver — both of which we’ve mentioned before for cracking WEP and WPA passwords, respectively.
However, WEP passwords aren’t that popular anymore (because they’re so easy to crack), and Reaver only works if a network has WPS enabled. So today, we’re going take another look at Aircrack and use it to brute force our way into a WPA network (with the help of a password list).
Step One: Configure Your Wireless Card

First things first: disconnect from all wireless networks. Then open up terminal. In order to use Aircrack, you’ll need a wireless card that supports injections. Type this into the Terminal to make sure your card supports it:
airmon-ng
This lists all the wireless cards that support this crack. If you card doesn’t support injections, it won’t show up here. Yours is likely listed under interface as wlan0, but it may depend on your machine.
Next, type in:
airmon-ng start wlan0
Replace
wlan0 with your card’s interface address. You should get a message back saying that monitor mode was enabled.Step Two: Monitor Your Network
Next, you’re going to get a list of all the networks in your area and monitor yours.
Type in:
airodump-ng mon0
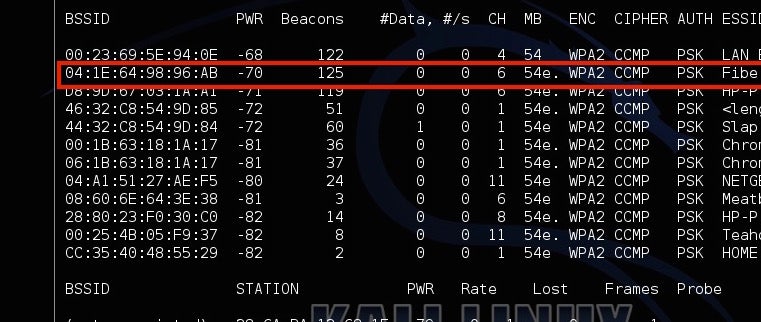
You’ll see all the networks in your area. Locate your network from the list, and copy the BSSID, while making a note of the channel it’s on. Type Ctrl+C to stop the process.
Next, type this in, replacing the information in parentheses with the information you gathered above:
airodump-ng -c (channel) --bssid (bssid) -w /root/Desktop/ (monitor interface)
It should read something like this:
airodump-ng -c 6 --bssid 04:1E:64:98:96:AB -w /root/Desktop/ mon0
Now, you’ll be monitoring your network. You should see four files pop up on the desktop. Don’t worry about those now; you’ll need one of them later. The next step is a bit of a waiting game, as you’ll be sitting around waiting for a device to connect to a network. In this case, just open up a device you own and connect to your Wi-Fi. You should see it pop up as a new station. Make a note of the station number, because you’ll need that in the next step.
Step Three: Capture A Handshake
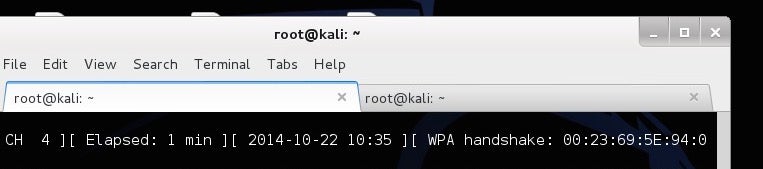
Now, you’re going to force a reconnect so you can capture the handshake between the computer and the router. Leave Airodump running and open up a new tab in Terminal. Then type in:
aireplay-ng -0 2 -a (router bssid) -c (client station number) mon0
It should look something like:
aireplay-ng -0 2 -a 04:1E:64:98:96:AB -c 54:4E:85:46:78:EA mon0
You’ll now see Aireplay send packets to your computer to force a reconnect. Hop back over to the Airodump tab and you’ll see a new number listed after WPA Handshake. If that’s there, you’ve successfully grabbed the handshake and you can start cracking the password.
Step Four: Crack The Password
You now have the router’s password in encrypted form, but you still need to actually figure out what it is. To do this, you’ll use a password list to try and brute force your way into the network. You can find these lists online, but Kali Linux includes a few small lists to get you started in the /usr/share/wordlists directory, so we’ll just use one of those. To start cracking the password type this in:
aircrack-ng -a2 -b (router bssid) -w (path to wordlist) /Root/Desktop/*.cap
So, continuing with our above example and using one of the built-in wordlists, it should read something like:
aircrack-ng -a2 -b 04:1E:64:98:96:AB -w /usr/share/wordlists/fern-wifi/common.txt /Root/Desktop/*.cap
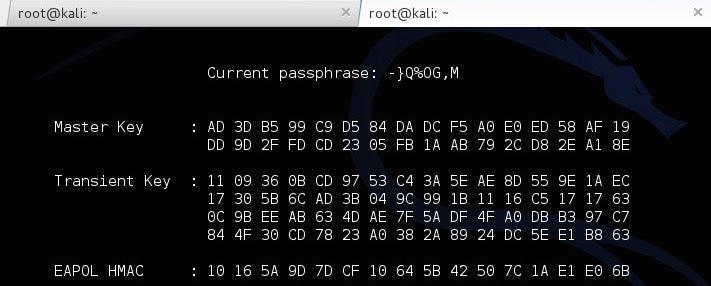
Now, Aircrack will try all of those passwords to see if one fits. If it does, you’ll get a message saying the key was found with the password. If not, give another one of the password lists a try until you find one that works. The bigger the password list, the longer this process will take, but the greater chance you have of succeeding.
How To Use This Information To Stay Safe
So, you just brute forced your way into your own network. Depending on how good your password is, it either took you five minutes or five hours. If your password is something simple, like “password123″, then chances are one of the smaller wordlists was able to crack it pretty quickly. If it was more complicated, it probably took a long time or never surfaced the password at all (if so: good for you!).
The best protection here is a good, strong password on your router. The longer, weirder and more complex it is, the better. Likewise, make sure you’re using the WPA2 security protocol and you don’t have WPS enabled.
Create A Fake Network With Airbase
Next up, let’s take a look at how you can spoof a network address to trick people into signing into the wrong network so you can watch what they’re doing. Hackers might do this so you sign into the fake network thinking it’s your real one, then performing a man-in-the-middle attack (more on that in the next section) to gather information about you from your traffic. This is amazingly easy to do with a tool in Kali Linux called Airbase.
Essentially, you’ll turn your Wi-Fi adaptor on Kali Linux into an access point with the same name as another network. In order to do this, you’ll follow the same line of research as you did above, but the ending’s a bit different.
Step One: Configure Your Wireless Card
Just like last time, you need to set up your wireless card to monitor traffic. Open up Terminal and type:
airmon-ng
This lists all the wireless cards that support this crack. Yours is likely listed under interface as wlan0.
Next, type in:
airmon-ng start wlan0
Now you’re in monitor mode. It’s time to find the network you want to spoof.
Step Two: Find A Wi-Fi Network To Spoof
In order to spoof a router, you’ll need some information about it. So, type in:
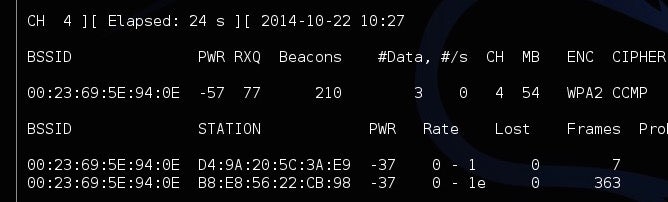
airodump-ng mon0
You’ll see all the networks in your area. Locate your network from the list and copy the BSSID, while making a note of its name and the channel it’s on. This is the router you’re going to spoof. Type Ctrl+C to stop the process.
Step Three: Create A Fake Network
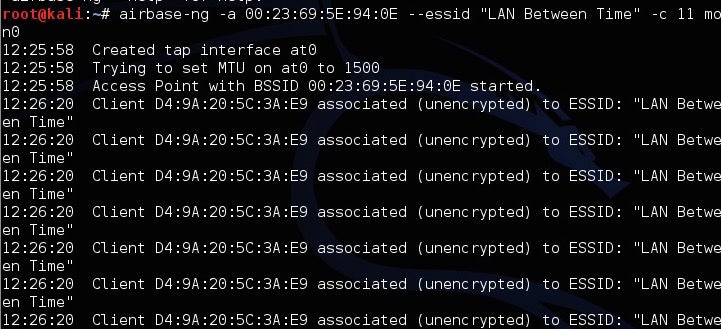
Now, you’re going to create the fake network with Airbase. Type this in, replacing the information you gathered in the last step for the parenthesis:
airbase-ng -a (router BSSID) --essid "(network name)" -c (channel) mon0
For example, it should read something like:
airbase-ng -a 04:1E:64:98:96:AB --essid "MyNetwork" -c 11 mon0
That’s it. You’ve now spoofed the router and created a clone with the same name, channel and SSID number so it’s indistinguishable from the original. Unfortunately, the computers on that network will always connect to the most powerful router with that name automatically, so you need to turn up the power of your fake network. Type in:
iwconfig wlan0 txpower 27
This bumps up the power of your fake network to the maximum accepted limit so hopefully next time they log in, they connect to you automatically. It shouldn’t do any damage to the card as long as you don’t go higher than 27. Once they do, it will be just like you’re both on the same network. That means you can access whatever they’re doing pretty easily.
How to Use This Information To Stay Safe
A spoofed network is tough to detect, but you can usually spot it when network traffic is slow, or if it suddenly doesn’t require a password authentication. If you’re really paranoid someone is spoofing a router, you can turn off the ability to automatically connect to Wi-Fi, so you at least have time to look at the router you’re logging into.
Snoop Another Device’s Traffic With ARP Spoofing
A man-in-the-middle attack is essentially eavesdropping on your network. Here, you’ll intercept network signals between a computer and a router without the computer realising it. We’ve shown you how to dopacket sniffing for that purpose; today we’ll use ARP spoofing to gather this information. Both sniffing and spoofing are about listening in on conversations, but they work a little differently. Sniffing captures traffic by monitoring a network, spoofing pretends to be that network. These types of attacks are often used to grab passwords, images and almost anything else you’re sending over your network.
Step One: Turn On Packet Forwarding
First things first, you need to make your Kali Linux machine forward any traffic it gets so the target computer can still access the internet. Type this into the command line:
echo 1 > /proc/sys/net/ipv4/ip_forward
This will ensure all information is forwarded after it’s intercepted. That way, the internet and any other communications between the router and the target computer will continue to work.
Step Two: Turn On ARP Spoofing

Now you need to turn on ARP spoofing. This tricks the computer and the router into thinking that your Wi-Fi adaptor is a bridge. When you successfully spoof, you can monitor all traffic between the devices. You’ll do this twice so you can capture traffic going to your computer from the router and from your computer to the router.
To capture traffic from your router type this in, replacing the parenthesis with your network’s information:
arpspoof -i wlan0 -t (router address) (target computer address)
You’ll see a bunch of number outputting showing that it’s running. Leave that running, then open another tab in Terminal and do the reverse:
arpspoof -i wlan -t (target computer address) (router address)
Both lines should look something like this:
arpspoof -i wlan0 -t 192.168.1.1 192.168.1.105arpspoof -i wlan0 -t 192.168.1.105 192.168.1.1
Now, all the traffic between those two machines is being collected in Kali Linux. There are a lot of tools to actually capture this information; we’ll take a look at a couple of them here.
To track any URLs the computer visits, open up another Terminal tab and type in:
urlsnarf -i wlan0
This will display any web sites the computer visits.
If you’re more interested in images, you can capture any image traffic as well. Type in:
driftnet -i wlan0
A window will pop up and display any images they load and transfer over the network. Basically, if there’s any unencrypted information being sent between the router and the computer, you’ll see it happen.
How To Use This Information To Stay Safe
The best way to keep people from ARP spoofing your network is to secure your network with a strong password and make sure they’re not in there in the first place. That said, turning on a firewall on your machine helps as well. Also, make sure you’re always using HTTPS when it’s available. When HTTPS is on, an ARP spoofer won’t capture anything you’re doing. This is especially important when you’re on public Wi-Fi and can’t control a network’s security.
REF: http://www.lifehacker.com.au/2014/10/how-to-hack-your-own-network-and-beef-up-its-security-with-kali-linux/
REF: http://www.lifehacker.com.au/2014/10/how-to-hack-your-own-network-and-beef-up-its-security-with-kali-linux/
Sunday, November 2, 2014
Network Ports
Common Network Ports:
| Service | Protocol | Port | TCP/UDP | Tools |
|---|---|---|---|---|
| World Wide Web | HTTP | 80 | TCP | browsers |
| Name Resolution | DNS | 53 | UDP | nslookup |
| File Transfer | FTP | 21 | TCP | ftp |
| Secure Remote Shell | SSH | 22 | TCP | ssh |
| Simple Mail Transfer Protocol | SMTP | 25 | TCP | email clients |
| Post Office Protocol Version 3 | POP3 | 110 | TCP | email clients |
| Secure Web | HTTPS | 443 | TCP | browsers |
| Remote Desktop ( microsoft-rdp) |
RDP | 3389 | TCP | rdesktop |
| File/Print Sharing ( microsoft-ds) |
SMB | 445 | TCP | map net- work drive |
| Internet Relay Chat | IRC | 6667 | TCP | xchat |
For the full list look here:
http://en.wikipedia.org/wiki/List_of_TCP_and_UDP_port_numbers
Network Recon Lab
From the Sans Institute:
This lab focuses on the practical application of techniques discusses in the Cyber-Recon lecture. Your class will be split up into a Gold team and a Blue team, where each team will gather as much information as possible about the security posture of the opposite team. The purpose of this task is, of course, to prepare you all for the inevitable cyber attack against your opponent that will follow next week.
Reconnaissance Intro
- Virtual OS. The virtual machines you will use in the next three labs use an operating system called Backtrack Linux, a variant of the Linux family of operating systems. Backtrack, and its current follower Kali Linux, are used by both the good guys, called "penetration testers", or "pen-testers" for short, as well as the bad guys. They contain an arsenal of cyber recon and attack tools. However, you should only use them on controlled systems where you have permission, and never to attack a real-world system.
- Shell Commands. Like the Windows command prompt, the
UNIX shell is your interface to the operating system. Some commands are
the same, some are very similar, and some are very different. A list of
useful commands and their Windows command equivalent (if applicable) is
provided in the adjacent note. Keep in mind: UNIX commands are case sensitive!
Useful UNIX Commands UNIX Command Windows Equivalent ls dir pwd cd cd path cd path cat type ping ping ifconfig ipconfig nslookup nslookup traceroute tracert nmap n/a nc nc
Reconnaissance Activity
Using the guidance below, gather as much information as possible about your opponent's network, in the given time. Record what you find on your worksheet!Your Objective
You are provided the following information (some of it you should record on your worksheet!):
| blue.net | gold.net | |
|---|---|---|
| IP block: | 1.1.1.1-255 | 2.2.2.1-255 |
| DNS Server: | 1.1.1.64 | 2.2.2.187 |
|
⇦ Fill in front of worksheet |
|
⇦ Draw on back of worksheet |
Note: Be sure you have used ifconfig to get your own host IP Address (look for "inet addr" next to the eth0
output) and use nslookup to determine your host domain name and your
team's web server and name server domain names/IP Addresses. Record the information on the top of your worksheet where your name and alpha are located.
Network Barrier Exploration
- Note: if you are on the Blue team, you will recon the Gold network. In the examples below, substitute "gold" where you see "blue". Do not include the < and > symbols in your commands!
- Obtain an IP Address on the target network.
nslookup www.blue.net
Put this information in the table on your worksheet for www.blue.net (or www.gold.net). - Find a route to the target network. Use
tracerouteto determine all of the routers between you and the web server for your your target,blue.net. Enter the following command in the terminal:traceroute -n www.blue.net
The router that is one hop away from the target is typically the target host's gateway router, which controls access to the target network with a firewall.Record the IP Address of all the routers along your route, including the one that appears to be the target's gateway in the circles on the circle diagram side of your worksheet ("Label with router IP Addresses" section).
NOTE 1: the -n option means no name resolution, just IP's. It's faster that way.
NOTE 2: Additional information about traceroute is located here. - Ping the web server. Use ping to verify that
www.blue.netis alive and responds to ping requests. This is a very important verification used to determine the ACL rules of the firewall, if present. If you receive a reply from the target, then you now know echo (ping) requests and replies are not filtered by the firewall.ping www.blue.net
Map the Target Network
- Scan for Hosts. Now that you have an IP Address on the
target network, take a guess at the range of IP Addresses that share the
network. A common subnet mask is 255.255.255.0, which leads to hosts
addresses in the range x.x.x.1-255, where x.x.x (the "network prefix")
is common among all hosts.
nmap -sn x.x.x.1-255
Take a look at the output. For our reconnaissance lab, we're going to disregard the addresses in the range x.x.x.101-111, since those are the student workstations. - Note the Hosts. Jot down the IP Addresses of all the hosts, other than those ending in .101 - .111, as noted above. You can also omit the .1 address for this lab, since the x.x.x.1 address is often the IP Address of the gateway router, by convention. You should see three other hosts; write their IP Addresses on your worksheet.
- Do a Port Scan. to get an initial take on what type of services might be running, scan the commonly-used ports on each of the hosts.
nmap -sS x.x.x.a,b,c
where a, b, and c are the last portions of the IP Addresses for the hosts you found. What open ports are there? What services appear to be running? Write these down on your worksheet. You can use this table of familiar services for those services that have a more common protocol/name you have seen before, instead of giving the obscure name nmap reports.
Service Protocol Port TCP/UDP Tools World Wide Web HTTP 80 TCP browsers Name Resolution DNS 53 UDP nslookup File Transfer FTP 21 TCP ftp Secure Remote Shell SSH 22 TCP ssh Simple Mail Transfer Protocol SMTP 25 TCP email clients Post Office Protocol Version 3 POP3 110 TCP email clients Secure Web HTTPS 443 TCP browsers Remote Desktop
(microsoft-rdp)RDP 3389 TCP rdesktop File/Print Sharing
(microsoft-ds)SMB 445 TCP map net-
work driveInternet Relay Chat IRC 6667 TCP xchat
- Find Some Names. Since one of the hosts appears to be a
name server (running the DNS service on port 53!), and we actually
already knew that name server's IP Address (given at the start of the
lab in the publicly available information), let's take advantage of that
by sending it some queries! Recall that we can specify the IP Address
we want to look up, and the IP Address of the name server to query, as
follows:
nslookup
For example:nslookup 5.5.5.22 5.5.5.17
This will lookup the IP Address 5.5.5.22 using the name server with IP 5.5.5.17.
For each of the three IP Addresses you found, perform this type of query. In one instance, of course, you'll be asking the name server for its own name! Record the domain names. - Find Service Names and Versions.
nmap -sV x.x.x.a,b,c
Note: The program version for the http (web) service not only indicates that it is Apache (well known program), but also indicates the general operating system on which it was compiled on. Ubuntu is a widely used UNIX distribution, Win32 is a version of Microsoft Windows, 32 bit, and Microsoft IIS is the Microsoft Internet Information Services web server software that Microsoft distributes as part of most Windows operating systems.
- Attempt to Determine OS Versions. Note the command option is the letter O, not the number zero.
nmap -O x.x.x.a,b,c
Note: OS detection will not always possible for various reasons, but even when OS detection is possible, the guess may not be accurate. Take note of OS detection results to compare with other indications (versions of the service software in the -sV scan) you find, but never accept them alone as fact. If given multiple OS versions, try to use the software running on the host as a clue to narrow down which actual operating system the host is likely to be running.
Host Barrier Exploration
- Web Server Host.
- Explore a Known Service. We know
www.blue.netis running http service because we were able to open a web page from it. This tells us that port 80 is open on the target host and destination port 80 is not filtered by the firewall, if present. Port 80 should go on a list of potential entry points. To gain some clue as to which web server is running on www.blue.net (so we can research its vulnerabilities later), connect to it using netcat.nc -v <IP Address here> 80
Once connected, request an http document by typing the following:GET / HTTP/1.0 ⇦ enter ⇦ enter
You have to be quick with your GET request - the system might time out. Search the response near the top for the line beginning with "Server" to see the http service family name and version. This is known as "banner grabbing" and it can be attempted on any port to gain information of a service. Though it will not always yield any useful information, it is always worth trying. You can also look through the raw HTML to see if there is anything of interest on that web page. Make a note of it in the Box on the back of your worksheet for recording web page clues.
- Explore a Known Service. We know
- All Three Hosts (Web Server, Name Server, and "Workstation"): Probe for Other Common Services.
Probe other ports to determine other potential infiltration points on
the target host and to further determine firewall rules, if present.
Below are two examples:
If a connection was made, typing
helpusually gets some sort of response from a target.- Test for ssh:
ssh x.x.x.x
Note: when you ssh to a host without providing a username, the program will assume you are logging in as root. You need to know root's password to log in as root. - Test for smtp (e-mail):
nc -v x.x.x.x 25
If you get connected, you should see the following message:220 mail.xxx.net ESMTP Postfix (Ubuntu)
Enterquitto terminate the connection as shown below.220 mail.xxx.net ESMTP Postfix (Ubuntu) quit ⇦ enter - Test for FTP (file transfer protocol):
nc -v x.x.x.x 21
orftp x.x.x.x
('exit' to quit) - Test for RDP (remote desktop):
nc -v x.x.x.x 3389
orrdesktop x.x.x.x
- On your worksheet, note all the services that appear to be running, and how you accessed them.
- Test for ssh:
Website Reconnaissance
- Visit your opponent's website (two pages)! Recall that passive reconnaissance includes browsing your target's network as a normal user would. Information on your target's website can be used to identify potential vulnerabilities to further explore during the infiltration phase. Don't forget to view each page's source code for hidden nuggets!
- Look for personal info. Personal information about users can be gathered from public web pages and is vital information for a variety of attacks (password attacks, social engineering).
- Test input forms for proper filtering, by trying HTML and Javascript input.
- Versions on the "non-Virtual" Web Site. In case you
do not complete the website reconnaissance in class links to mirrors of
the websites for blue.net and gold.net are provided below. Note: the
mirrors are static pages only. You will be unable to access the virtual
machine environment outside of class.
- Mirror of www.blue.net
- Mirror of www.gold.net
Summary
By the end of the lab, you should have drawn a "concentric circles" target diagram of your opponent's network, like the one shown in the Cyber Reconnaissance lecture.Ref: http://www.usna.edu/CS/si110/lec/l38/lec.html
Basic Linux & Windows commands paralleled
\, while UNIX uses /. Remember also that Windows has different directory trees, one for each drive letter (file system). UNIX has only one tree.
Basic Shell Commands
Most commonly used:
| UNIX Command | Windows Equivalent |
|---|---|
| ls | dir |
| pwd | cd |
| cd path | cd path |
| cat | type |
| ping | ping |
| ifconfig | ipconfig |
| nslookup | nslookup |
| traceroute | tracert |
| nmap | n/a |
| nc | nc |
| Windows | UNIX | Summary | Ex (Windows) | Ex (UNIX) |
| dir | ls | list contents of current directory |
C:> dir
|
$ ls
|
| cd | pwd | display current directory |
C:> cd
|
$ pwd
|
| cd path | cd path | change current directory |
C:> cd \Users\m159999
|
$ cd /home/m159999
|
| copy path1 path2 | cp path1 path2 | copy file path1 to name/location path2 |
C:> copy foo.txt bar.txt
|
$ cp foo.txt bar.txt
|
| move path path | mv path path | move file path1 to name/location path2 |
C:> move foo.txt ..\backup\
|
$ mv foo.txt ../backup/
|
| del path | rm path | delete file path |
C:> del foo.txt
|
$ rm foo.txt
|
| rmdir path | rmdir path | delete folder/directory path |
C:> rmdir images
|
$ rmdir images
|
| mkdir path | mkdir path | create folder/directory path |
C:> mkdir images
|
$ mkdir images
|
| type path | cat path | print file path to screen |
C:> type index.html
|
$ cat index.html
|
| Notepad path |
gedit path nano path |
Open file path in a text editor ( nano doesn't require
the GUI)
|
C:> Notepad foo.txt |
$ gedit foo.txt$ nano foo.txt
|
| whoami | whoami | Tells the username for the account that is executing the command. | C:> whoami |
$ whoami |
Basic Networking Tools
| Tool | Summary | Examples |
| ssh | Open shell on remote UNIX host securely. | $ ssh m159999@rona.cs.usna.edu |
| rdesktop | Open desktop on remote Windows host securely. | $ rdesktop mich300csd01w.academy.usna.edu |
| ping | Check whether host with name/IPAddess is alive | $ ping 10.2.0.5 |
| trace[route/rt] | Determine route taken by packets to given host | $ traceroute www.mit.edu |
| nslookup | Translates domain names to IP addresses and vice versa Optional second argument specifies what nameserver to use. |
C:> nslookup www.mit.edu$ nslookup www.mit.edu ns1.usna.edu
|
| ipconfig ifconfig |
Displays information about current network settings ipconfig is for Windows, ifconfig is for UNIX. |
C:> ipconfig$ ifconfig |
| netstat | Displays information on current port usage (-a shows "all") | $ netstat -a |
| nc | Netcat - lets you send and recieve tcp/udp traffic | $ nc 143.84.217.3 80 |
| hostname | Tells you the name of the "host" (i.e. computer) that's executing the command. | $ hostname |
Follow these steps to open an Administrator shell in Windows:
- Press the System (Windows) key
- Type in: cmd
- Right-click
cmd.exeto bring up the context menu. - Select Run as administrator.
tcpdump on PFSense
From PFSense manual:
WebGUI Packet Captures
You can perform a capture from within the WebGUI under Diagnostics > Packet Capture. The settings work just as they would with tcpdump. The capture can be viewed in the GUI or downloaded for later viewing with tcpdump or Wireshark.tcpdump
tcpdump comes installed with pfSense. You can use tcpdump from the pfsense Diagnostics drop down menu. Select Command and run your dump.Another way is to SSH into a shell and run tcpdump. In this example a method of capturing traffic other than SSH, ARP, DNS and STP is highlighted. The capture will be directed to a file called Sniff_output in the current directory.
tcpdump -i fxp0 not port 22 and not port 53 and not arp and not stp >> Sniff_output
The -i is designating traffic from the fxp0 interface. In this example traffic from one of the subnets fxp0 connected to pfSense is being grabbed.
To automate this capture you can place the tcpdump in a file, make that file executable; chmod U+x, and place it in /usr/local/etc/rc.d. When pfsense comes up your script should start automatically.
iftop
A second method of sniffing traffic via a shell is with iftop. The method of installing iftop is highlighted on this wiki page Add_Packages.iftop will allow you to designate the interface from which you would like to grab traffic. In this example fxp1 is the LAN Interface
iftop -i fxp1
Sample Output
cf-in-f18.google.com              => 192.168.1.245                        0b
                                  <=                                      0b
cf-in-f97.google.com              => 192.168.1.245                        0b
                                  <=                                      0b
cf-in-f103.google.com             => 192.168.1.245                        0b
                                  <=                                      0b
google.navigation.opendns.com     => 192.168.1.245                        0b
                                  <=                                      0b
PFtop
PFtop is a very cool tool built into pfSense that can monitor traffic/connections. This tool can be found in the GUI under Diagnostics > pftop (2.0 and later) or by connecting to pfsense via SSH.TCPDUMP
This is one of the most popular network monitoring tools. I like it because it runs on just about anything and it's easy to use.
USAGE:tcpdump - dump traffic on a network
SYNOPSIS
tcpdump [ -AbdDefhHIJKlLnNOpqRStuUvxX# ] [ -B buffer_size ][ -c count ]
[ -C file_size ] [ -G rotate_seconds ] [ -F file ]
[ -i interface ] [ -j tstamp_type ] [ -m module ] [ -M secret ]
[ --number ] [ -Q in|out|inout ]
[ -r file ] [ -V file ] [ -s snaplen ] [ -T type ] [ -w file ]
[ -W filecount ]
[ -E spi@ipaddr algo:secret,... ]
[ -y datalinktype ] [ -z postrotate-command ] [ -Z user ]
[ --time-stamp-precision=tstamp_precision ] [ --version ]
[ expression ]
DESCRIPTION
Tcpdump prints out a description of the contents of packets on a network interface that match the boolean expression. It can also be run with the -w flag, which causes it to save the packet data to a file for later analysis, and/or with the -r flag, which causes it to read from a saved packet file rather than to read packets from a network interface. It can also be run with the -V flag, which causes it to read a list of saved packet files. In all cases, only packets that match expression will be processed by tcpdump.Tcpdump will, if not run with the -c flag, continue capturing packets until it is interrupted by a SIGINT signal (generated, for example, by typing your interrupt character, typically control-C) or a SIGTERM signal (typically generated with the kill(1) command); if run with the -c flag, it will capture packets until it is interrupted by a SIGINT or SIGTERM signal or the specified number of packets have been processed.
When tcpdump finishes capturing packets, it will report counts of:
- packets ``captured'' (this is the number of packets that tcpdump has received and processed);
- packets ``received by filter'' (the meaning of this depends on the OS on which you're running tcpdump, and possibly on the way the OS was configured - if a filter was specified on the command line, on some OSes it counts packets regardless of whether they were matched by the filter expression and, even if they were matched by the filter expression, regardless of whether tcpdump has read and processed them yet, on other OSes it counts only packets that were matched by the filter expression regardless of whether tcpdump has read and processed them yet, and on other OSes it counts only packets that were matched by the filter expression and were processed by tcpdump);
- packets ``dropped by kernel'' (this is the number of packets that were dropped, due to a lack of buffer space, by the packet capture mechanism in the OS on which tcpdump is running, if the OS reports that information to applications; if not, it will be reported as 0).
Reading packets from a network interface may require that you have special privileges; see the pcap (3PCAP) man page for details. Reading a saved packet file doesn't require special privileges.
OPTIONS
- -A
- Print each packet (minus its link level header) in ASCII. Handy for capturing web pages.
- -b
- Print the AS number in BGP packets in ASDOT notation rather than ASPLAIN notation.
- -B buffer_size
- --buffer-size=buffer_size
- Set the operating system capture buffer size to buffer_size, in units of KiB (1024 bytes).
- -c count
- Exit after receiving count packets.
- -C file_size
- Before writing a raw packet to a savefile, check whether the file is currently larger than file_size and, if so, close the current savefile and open a new one. Savefiles after the first savefile will have the name specified with the -w flag, with a number after it, starting at 1 and continuing upward. The units of file_size are millions of bytes (1,000,000 bytes, not 1,048,576 bytes).
- -d
- Dump the compiled packet-matching code in a human readable form to standard output and stop.
- -dd
- Dump packet-matching code as a C program fragment.
- -ddd
- Dump packet-matching code as decimal numbers (preceded with a count).
- -D
- --list-interfaces
- Print the list of the network interfaces available on the system and on which tcpdump can capture packets. For each network interface, a number and an interface name, possibly followed by a text description of the interface, is printed. The interface name or the number can be supplied to the -i flag to specify an interface on which to capture.
- This can be useful on systems that don't have a command to list them (e.g., Windows systems, or UNIX systems lacking ifconfig -a); the number can be useful on Windows 2000 and later systems, where the interface name is a somewhat complex string.
- The -D flag will not be supported if tcpdump was built with an older version of libpcap that lacks the pcap_findalldevs() function.
- -e
- Print the link-level header on each dump line. This can be used, for example, to print MAC layer addresses for protocols such as Ethernet and IEEE 802.11.
- -E
- Use spi@ipaddr algo:secret for decrypting IPsec ESP packets that are addressed to addr and contain Security Parameter Index value spi. This combination may be repeated with comma or newline separation.
- Note that setting the secret for IPv4 ESP packets is supported at this time.
- Algorithms may be des-cbc, 3des-cbc, blowfish-cbc, rc3-cbc, cast128-cbc, or none. The default is des-cbc. The ability to decrypt packets is only present if tcpdump was compiled with cryptography enabled.
- secret is the ASCII text for ESP secret key. If preceded by 0x, then a hex value will be read.
- The option assumes RFC2406 ESP, not RFC1827 ESP. The option is only for debugging purposes, and the use of this option with a true `secret' key is discouraged. By presenting IPsec secret key onto command line you make it visible to others, via ps(1) and other occasions.
- In addition to the above syntax, the syntax file name may be used to have tcpdump read the provided file in. The file is opened upon receiving the first ESP packet, so any special permissions that tcpdump may have been given should already have been given up.
- -f
- Print `foreign' IPv4 addresses numerically rather than symbolically (this option is intended to get around serious brain damage in Sun's NIS server --- usually it hangs forever translating non-local internet numbers).
- The test for `foreign' IPv4 addresses is done using the IPv4 address and netmask of the interface on which capture is being done. If that address or netmask are not available, available, either because the interface on which capture is being done has no address or netmask or because the capture is being done on the Linux "any" interface, which can capture on more than one interface, this option will not work correctly.
- -F file
- Use file as input for the filter expression. An additional expression given on the command line is ignored.
- -G rotate_seconds
- If specified, rotates the dump file specified with the -w option every rotate_seconds seconds. Savefiles will have the name specified by -w which should include a time format as defined by strftime(3). If no time format is specified, each new file will overwrite the previous.
- If used in conjunction with the -C option, filenames will take the form of `file<count>'.
- -h
- --help
- Print the tcpdump and libpcap version strings, print a usage message, and exit.
- --version
- Print the tcpdump and libpcap version strings and exit.
- -H
- Attempt to detect 802.11s draft mesh headers.
- -i interface
- --interface=interface
- Listen on interface. If unspecified, tcpdump searches the system interface list for the lowest numbered, configured up interface (excluding loopback), which may turn out to be, for example, ``eth0''.
- On Linux systems with 2.2 or later kernels, an interface argument of ``any'' can be used to capture packets from all interfaces. Note that captures on the ``any'' device will not be done in promiscuous mode.
- If the -D flag is supported, an interface number as printed by that flag can be used as the interface argument.
- -I
- --monitor-mode
- Put the interface in "monitor mode"; this is supported only on IEEE 802.11 Wi-Fi interfaces, and supported only on some operating systems.
- Note that in monitor mode the adapter might disassociate from the network with which it's associated, so that you will not be able to use any wireless networks with that adapter. This could prevent accessing files on a network server, or resolving host names or network addresses, if you are capturing in monitor mode and are not connected to another network with another adapter.
- This flag will affect the output of the -L flag. If -I isn't specified, only those link-layer types available when not in monitor mode will be shown; if -I is specified, only those link-layer types available when in monitor mode will be shown.
- -j tstamp_type
- --time-stamp-type=tstamp_type
- Set the time stamp type for the capture to tstamp_type. The names to use for the time stamp types are given in pcap-tstamp(7); not all the types listed there will necessarily be valid for any given interface.
- -J
- --list-time-stamp-types
- List the supported time stamp types for the interface and exit. If the time stamp type cannot be set for the interface, no time stamp types are listed.
- --time-stamp-precision=tstamp_precision
- When capturing, set the time stamp precision for the capture to tstamp_precision. Note that availability of high precision time stamps (nanoseconds) and their actual accuracy is platform and hardware dependent. Also note that when writing captures made with nanosecond accuracy to a savefile, the time stamps are written with nanosecond resolution, and the file is written with a different magic number, to indicate that the time stamps are in seconds and nanoseconds; not all programs that read pcap savefiles will be able to read those captures.
The supported values for timestamp_precision are micro for microsecond resolution and nano for nanosecond resolution. The default is microsecond resolution.
- -K
- --dont-verify-checksums
- Don't attempt to verify IP, TCP, or UDP checksums. This is useful for interfaces that perform some or all of those checksum calculation in hardware; otherwise, all outgoing TCP checksums will be flagged as bad.
- -l
- Make stdout line buffered. Useful if you want to see the data while capturing it. E.g.,
-
-
tcpdump -l | tee dat
-
- or
-
-
tcpdump -l > dat & tail -f dat
-
- Note that on Windows,``line buffered'' means ``unbuffered'', so that WinDump will write each character individually if -l is specified.
- -U is similar to -l in its behavior, but it will cause output to be ``packet-buffered'', so that the output is written to stdout at the end of each packet rather than at the end of each line; this is buffered on all platforms, including Windows.
- -L
- --list-data-link-types
- List the known data link types for the interface, in the specified mode, and exit. The list of known data link types may be dependent on the specified mode; for example, on some platforms, a Wi-Fi interface might support one set of data link types when not in monitor mode (for example, it might support only fake Ethernet headers, or might support 802.11 headers but not support 802.11 headers with radio information) and another set of data link types when in monitor mode (for example, it might support 802.11 headers, or 802.11 headers with radio information, only in monitor mode).
- -m module
- Load SMI MIB module definitions from file module. This option can be used several times to load several MIB modules into tcpdump.
- -M secret
- Use secret as a shared secret for validating the digests found in TCP segments with the TCP-MD5 option (RFC 2385), if present.
- -n
- Don't convert addresses (i.e., host addresses, port numbers, etc.) to names.
- -N
- Don't print domain name qualification of host names. E.g., if you give this flag then tcpdump will print ``nic'' instead of ``nic.ddn.mil''.
- -#
- --number
- Print an optional packet number at the beginning of the line.
- -O
- --no-optimize
- Do not run the packet-matching code optimizer. This is useful only if you suspect a bug in the optimizer.
- -p
- --no-promiscuous-mode
- Don't put the interface into promiscuous mode. Note that the interface might be in promiscuous mode for some other reason; hence, `-p' cannot be used as an abbreviation for `ether host {local-hw-addr} or ether broadcast'.
- -Q direction
- --direction=direction
- Choose send/receive direction direction for which packets should be captured. Possible values are `in', `out' and `inout'. Not available on all platforms.
- -q
- Quick (quiet?) output. Print less protocol information so output lines are shorter.
- -R
- Assume ESP/AH packets to be based on old specification (RFC1825 to RFC1829). If specified, tcpdump will not print replay prevention field. Since there is no protocol version field in ESP/AH specification, tcpdump cannot deduce the version of ESP/AH protocol.
- -r file
- Read packets from file (which was created with the -w option or by other tools that write pcap or pcap-ng files). Standard input is used if file is ``-''.
- -S
- --absolute-tcp-sequence-numbers
- Print absolute, rather than relative, TCP sequence numbers.
- -s snaplen
- --snapshot-length=snaplen
- Snarf snaplen bytes of data from each packet rather than the default of 65535 bytes. Packets truncated because of a limited snapshot are indicated in the output with ``[|proto]'', whereproto is the name of the protocol level at which the truncation has occurred. Note that taking larger snapshots both increases the amount of time it takes to process packets and, effectively, decreases the amount of packet buffering. This may cause packets to be lost. You should limit snaplen to the smallest number that will capture the protocol information you're interested in. Setting snaplen to 0 sets it to the default of 65535, for backwards compatibility with recent older versions of tcpdump.
- -T type
- Force packets selected by "expression" to be interpreted the specified type. Currently known types are aodv (Ad-hoc On-demand Distance Vector protocol), carp (Common Address Redundancy Protocol), cnfp (Cisco NetFlow protocol), lmp (Link Management Protocol), pgm (Pragmatic General Multicast), pgm_zmtp1 (ZMTP/1.0 inside PGM/EPGM), radius(RADIUS), rpc (Remote Procedure Call), rtp (Real-Time Applications protocol), rtcp (Real-Time Applications control protocol), snmp (Simple Network Management Protocol), tftp(Trivial File Transfer Protocol), vat (Visual Audio Tool), wb (distributed White Board), zmtp1 (ZeroMQ Message Transport Protocol 1.0) and vxlan (Virtual eXtensible Local Area Network).
- Note that the pgm type above affects UDP interpretation only, the native PGM is always recognised as IP protocol 113 regardless. UDP-encapsulated PGM is often called "EPGM" or "PGM/UDP".
- Note that the pgm_zmtp1 type above affects interpretation of both native PGM and UDP at once. During the native PGM decoding the application data of an ODATA/RDATA packet would be decoded as a ZeroMQ datagram with ZMTP/1.0 frames. During the UDP decoding in addition to that any UDP packet would be treated as an encapsulated PGM packet.
- -t
- Don't print a timestamp on each dump line.
- -tt
- Print an unformatted timestamp on each dump line.
- -ttt
- Print a delta (micro-second resolution) between current and previous line on each dump line.
- -tttt
- Print a timestamp in default format proceeded by date on each dump line.
- -ttttt
- Print a delta (micro-second resolution) between current and first line on each dump line.
- -u
- Print undecoded NFS handles.
- -U
- --packet-buffered
- If the -w option is not specified, make the printed packet output ``packet-buffered''; i.e., as the description of the contents of each packet is printed, it will be written to the standard output, rather than, when not writing to a terminal, being written only when the output buffer fills.
- If the -w option is specified, make the saved raw packet output ``packet-buffered''; i.e., as each packet is saved, it will be written to the output file, rather than being written only when the output buffer fills.
- The -U flag will not be supported if tcpdump was built with an older version of libpcap that lacks the pcap_dump_flush() function.
- -v
- When parsing and printing, produce (slightly more) verbose output. For example, the time to live, identification, total length and options in an IP packet are printed. Also enables additional packet integrity checks such as verifying the IP and ICMP header checksum.
- When writing to a file with the -w option, report, every 10 seconds, the number of packets captured.
- -vv
- Even more verbose output. For example, additional fields are printed from NFS reply packets, and SMB packets are fully decoded.
- -vvv
- Even more verbose output. For example, telnet SB ... SE options are printed in full. With -X Telnet options are printed in hex as well.
- -V file
- Read a list of filenames from file. Standard input is used if file is ``-''.
- -w file
- Write the raw packets to file rather than parsing and printing them out. They can later be printed with the -r option. Standard output is used if file is ``-''.
- This output will be buffered if written to a file or pipe, so a program reading from the file or pipe may not see packets for an arbitrary amount of time after they are received. Use the -U flag to cause packets to be written as soon as they are received.
- The MIME type application/vnd.tcpdump.pcap has been registered with IANA for pcap files. The filename extension .pcap appears to be the most commonly used along with .cap and.dmp. Tcpdump itself doesn't check the extension when reading capture files and doesn't add an extension when writing them (it uses magic numbers in the file header instead). However, many operating systems and applications will use the extension if it is present and adding one (e.g. .pcap) is recommended.
- See pcap-savefile(5) for a description of the file format.
- -W
- Used in conjunction with the -C option, this will limit the number of files created to the specified number, and begin overwriting files from the beginning, thus creating a 'rotating' buffer. In addition, it will name the files with enough leading 0s to support the maximum number of files, allowing them to sort correctly.
- Used in conjunction with the -G option, this will limit the number of rotated dump files that get created, exiting with status 0 when reaching the limit. If used with -C as well, the behavior will result in cyclical files per timeslice.
- -x
- When parsing and printing, in addition to printing the headers of each packet, print the data of each packet (minus its link level header) in hex. The smaller of the entire packet orsnaplen bytes will be printed. Note that this is the entire link-layer packet, so for link layers that pad (e.g. Ethernet), the padding bytes will also be printed when the higher layer packet is shorter than the required padding.
- -xx
- When parsing and printing, in addition to printing the headers of each packet, print the data of each packet, including its link level header, in hex.
- -X
- When parsing and printing, in addition to printing the headers of each packet, print the data of each packet (minus its link level header) in hex and ASCII. This is very handy for analysing new protocols.
- -XX
- When parsing and printing, in addition to printing the headers of each packet, print the data of each packet, including its link level header, in hex and ASCII.
- -y datalinktype
- --linktype=datalinktype
- Set the data link type to use while capturing packets to datalinktype.
- -z postrotate-command
- Used in conjunction with the -C or -G options, this will make tcpdump run " postrotate-command file " where file is the savefile being closed after each rotation. For example, specifying -z gzip or -z bzip2 will compress each savefile using gzip or bzip2.
- Note that tcpdump will run the command in parallel to the capture, using the lowest priority so that this doesn't disturb the capture process.
- And in case you would like to use a command that itself takes flags or different arguments, you can always write a shell script that will take the savefile name as the only argument, make the flags & arguments arrangements and execute the command that you want.
- -Z user
- --relinquish-privileges=user
- If tcpdump is running as root, after opening the capture device or input savefile, but before opening any savefiles for output, change the user ID to user and the group ID to the primary group of user.
- This behavior can also be enabled by default at compile time.
- expression
-
- selects which packets will be dumped. If no expression is given, all packets on the net will be dumped. Otherwise, only packets for which expression is `true' will be dumped.For the expression syntax, see pcap-filter(7).
The expression argument can be passed to tcpdump as either a single Shell argument, or as multiple Shell arguments, whichever is more convenient. Generally, if the expression contains Shell metacharacters, such as backslashes used to escape protocol names, it is easier to pass it as a single, quoted argument rather than to escape the Shell metacharacters. Multiple arguments are concatenated with spaces before being parsed.
- selects which packets will be dumped. If no expression is given, all packets on the net will be dumped. Otherwise, only packets for which expression is `true' will be dumped.For the expression syntax, see pcap-filter(7).
EXAMPLES
To print all packets arriving at or departing from sundown:tcpdump host sundown
tcpdump host helios and \( hot or ace \)
tcpdump ip host ace and not helios
tcpdump net ucb-ether
tcpdump 'gateway snup and (port ftp or ftp-data)'
tcpdump ip and not net localnet
tcpdump 'tcp[tcpflags] & (tcp-syn|tcp-fin) != 0 and not src and dst net localnet'
tcpdump 'tcp port 80 and (((ip[2:2] - ((ip[0]&0xf)<<2)) - ((tcp[12]&0xf0)>>2)) != 0)'
tcpdump 'gateway snup and ip[2:2] > 576'
tcpdump 'ether[0] & 1 = 0 and ip[16] >= 224'
tcpdump 'icmp[icmptype] != icmp-echo and icmp[icmptype] != icmp-echoreply'
OUTPUT FORMAT
The output of tcpdump is protocol dependent. The following gives a brief description and examples of most of the formats.Link Level Headers
If the '-e' option is given, the link level header is printed out. On Ethernets, the source and destination addresses, protocol, and packet length are printed.
On FDDI networks, the '-e' option causes tcpdump to print the `frame control' field, the source and destination addresses, and the packet length. (The `frame control' field governs the interpretation of the rest of the packet. Normal packets (such as those containing IP datagrams) are `async' packets, with a priority value between 0 and 7; for example, `async4'. Such packets are assumed to contain an 802.2 Logical Link Control (LLC) packet; the LLC header is printed if it is not an ISO datagram or a so-called SNAP packet.
On Token Ring networks, the '-e' option causes tcpdump to print the `access control' and `frame control' fields, the source and destination addresses, and the packet length. As on FDDI networks, packets are assumed to contain an LLC packet. Regardless of whether the '-e' option is specified or not, the source routing information is printed for source-routed packets.
On 802.11 networks, the '-e' option causes tcpdump to print the `frame control' fields, all of the addresses in the 802.11 header, and the packet length. As on FDDI networks, packets are assumed to contain an LLC packet.
(N.B.: The following description assumes familiarity with the SLIP compression algorithm described in RFC-1144.)
On SLIP links, a direction indicator (``I'' for inbound, ``O'' for outbound), packet type, and compression information are printed out. The packet type is printed first. The three types are ip,utcp, and ctcp. No further link information is printed for ip packets. For TCP packets, the connection identifier is printed following the type. If the packet is compressed, its encoded header is printed out. The special cases are printed out as *S+n and *SA+n, where n is the amount by which the sequence number (or sequence number and ack) has changed. If it is not a special case, zero or more changes are printed. A change is indicated by U (urgent pointer), W (window), A (ack), S (sequence number), and I (packet ID), followed by a delta (+n or -n), or a new value (=n). Finally, the amount of data in the packet and compressed header length are printed.
For example, the following line shows an outbound compressed TCP packet, with an implicit connection identifier; the ack has changed by 6, the sequence number by 49, and the packet ID by 6; there are 3 bytes of data and 6 bytes of compressed header:
O ctcp * A+6 S+49 I+6 3 (6)
Arp/rarp output shows the type of request and its arguments. The format is intended to be self explanatory. Here is a short sample taken from the start of an `rlogin' from host rtsg to hostcsam:
arp who-has csam tell rtsg
arp reply csam is-at CSAM
This would look less redundant if we had done tcpdump -n:
arp who-has 128.3.254.6 tell 128.3.254.68
arp reply 128.3.254.6 is-at 02:07:01:00:01:c4
RTSG Broadcast 0806  64: arp who-has csam tell rtsg
CSAM RTSG 0806  64: arp reply csam is-at CSAM
TCP Packets
(N.B.:The following description assumes familiarity with the TCP protocol described in RFC-793. If you are not familiar with the protocol, neither this description nor tcpdump will be of much use to you.)
The general format of a tcp protocol line is:
src > dst: flags data-seqno ack window urgent options
Src, dst and flags are always present. The other fields depend on the contents of the packet's tcp protocol header and are output only if appropriate.
Here is the opening portion of an rlogin from host rtsg to host csam.
rtsg.1023 > csam.login: S 768512:768512(0) win 4096 <mss 1024>
csam.login > rtsg.1023: S 947648:947648(0) ack 768513 win 4096 <mss 1024>
rtsg.1023 > csam.login: . ack 1 win 4096
rtsg.1023 > csam.login: P 1:2(1) ack 1 win 4096
csam.login > rtsg.1023: . ack 2 win 4096
rtsg.1023 > csam.login: P 2:21(19) ack 1 win 4096
csam.login > rtsg.1023: P 1:2(1) ack 21 win 4077
csam.login > rtsg.1023: P 2:3(1) ack 21 win 4077 urg 1
csam.login > rtsg.1023: P 3:4(1) ack 21 win 4077 urg 1
Csam replies with a similar packet except it includes a piggy-backed ack for rtsg's SYN. Rtsg then acks csam's SYN. The `.' means the ACK flag was set. The packet contained no data so there is no data sequence number. Note that the ack sequence number is a small integer (1). The first time tcpdump sees a tcp `conversation', it prints the sequence number from the packet. On subsequent packets of the conversation, the difference between the current packet's sequence number and this initial sequence number is printed. This means that sequence numbers after the first can be interpreted as relative byte positions in the conversation's data stream (with the first data byte each direction being `1'). `-S' will override this feature, causing the original sequence numbers to be output.
On the 6th line, rtsg sends csam 19 bytes of data (bytes 2 through 20 in the rtsg → csam side of the conversation). The PUSH flag is set in the packet. On the 7th line, csam says it's received data sent by rtsg up to but not including byte 21. Most of this data is apparently sitting in the socket buffer since csam's receive window has gotten 19 bytes smaller. Csam also sends one byte of data to rtsg in this packet. On the 8th and 9th lines, csam sends two bytes of urgent, pushed data to rtsg.
If the snapshot was small enough that tcpdump didn't capture the full TCP header, it interprets as much of the header as it can and then reports ``[|tcp]'' to indicate the remainder could not be interpreted. If the header contains a bogus option (one with a length that's either too small or beyond the end of the header), tcpdump reports it as ``[bad opt]'' and does not interpret any further options (since it's impossible to tell where they start). If the header length indicates options are present but the IP datagram length is not long enough for the options to actually be there, tcpdump reports it as ``[bad hdr length]''.
Capturing TCP packets with particular flag combinations (SYN-ACK, URG-ACK, etc.)
There are 8 bits in the control bits section of the TCP header:
- CWR | ECE | URG | ACK | PSH | RST | SYN | FIN
- 1) Caller sends SYN
- 2) Recipient responds with SYN, ACK
- 3) Caller sends ACK
Recall the structure of a TCP header without options:
 0                            15                              31
-----------------------------------------------------------------
|          source port          |       destination port        |
-----------------------------------------------------------------
|                        sequence number                        |
-----------------------------------------------------------------
|                     acknowledgment number                     |
-----------------------------------------------------------------
|  HL   | rsvd  |C|E|U|A|P|R|S|F|        window size            |
-----------------------------------------------------------------
|         TCP checksum          |       urgent pointer          |
-----------------------------------------------------------------
A TCP header usually holds 20 octets of data, unless options are present. The first line of the graph contains octets 0 - 3, the second line shows octets 4 - 7 etc.
Starting to count with 0, the relevant TCP control bits are contained in octet 13:
 0             7|             15|             23|             31
----------------|---------------|---------------|----------------
|  HL   | rsvd  |C|E|U|A|P|R|S|F|        window size            |
----------------|---------------|---------------|----------------
|               |  13th octet   |               |               |
Let's have a closer look at octet no. 13:
                |               |
                |---------------|
                |C|E|U|A|P|R|S|F|
                |---------------|
                |7   5   3     0|
These are the TCP control bits we are interested in. We have numbered the bits in this octet from 0 to 7, right to left, so the PSH bit is bit number 3, while the URG bit is number 5.Recall that we want to capture packets with only SYN set. Let's see what happens to octet 13 if a TCP datagram arrives with the SYN bit set in its header:
                |C|E|U|A|P|R|S|F|
                |---------------|
                |0 0 0 0 0 0 1 0|
                |---------------|
                |7 6 5 4 3 2 1 0|
Looking at the control bits section we see that only bit number 1 (SYN) is set.Assuming that octet number 13 is an 8-bit unsigned integer in network byte order, the binary value of this octet is
- 00000010
   7     6     5     4     3     2     1     0
0*2 + 0*2 + 0*2 + 0*2 + 0*2 + 0*2 + 1*2 + 0*2  =  2
We're almost done, because now we know that if only SYN is set, the value of the 13th octet in the TCP header, when interpreted as a 8-bit unsigned integer in network byte order, must be exactly 2.
This relationship can be expressed as
- tcp[13] == 2
- tcpdump -i xl0 tcp[13] == 2
Now, let's assume that we need to capture SYN packets, but we don't care if ACK or any other TCP control bit is set at the same time. Let's see what happens to octet 13 when a TCP datagram with SYN-ACK set arrives:
     |C|E|U|A|P|R|S|F|
     |---------------|
     |0 0 0 1 0 0 1 0|
     |---------------|
     |7 6 5 4 3 2 1 0|
Now bits 1 and 4 are set in the 13th octet. The binary value of octet 13 is
00010010
   7     6     5     4     3     2     1     0
0*2 + 0*2 + 0*2 + 1*2 + 0*2 + 0*2 + 1*2 + 0*2   = 18
Now we can't just use 'tcp[13] == 18' in the tcpdump filter expression, because that would select only those packets that have SYN-ACK set, but not those with only SYN set. Remember that we don't care if ACK or any other control bit is set as long as SYN is set.
In order to achieve our goal, we need to logically AND the binary value of octet 13 with some other value to preserve the SYN bit. We know that we want SYN to be set in any case, so we'll logically AND the value in the 13th octet with the binary value of a SYN:
          00010010 SYN-ACK              00000010 SYN
     AND  00000010 (we want SYN)   AND  00000010 (we want SYN)
          --------                      --------
     =    00000010                 =    00000010
We see that this AND operation delivers the same result regardless whether ACK or another TCP control bit is set. The decimal representation of the AND value as well as the result of this operation is 2 (binary 00000010), so we know that for packets with SYN set the following relation must hold true:- ( ( value of octet 13 ) AND ( 2 ) ) == ( 2 )
tcpdump -i xl0 'tcp[13] & 2 == 2'
This can be demonstrated as:
tcpdump -i xl0 'tcp[tcpflags] & tcp-push != 0'
UDP Packets
UDP format is illustrated by this rwho packet:
actinide.who > broadcast.who: udp 84
Some UDP services are recognized (from the source or destination port number) and the higher level protocol information printed. In particular, Domain Name service requests (RFC-1034/1035) and Sun RPC calls (RFC-1050) to NFS.
UDP Name Server Requests
(N.B.:The following description assumes familiarity with the Domain Service protocol described in RFC-1035. If you are not familiar with the protocol, the following description will appear to be written in greek.)
Name server requests are formatted as
src > dst: id op? flags qtype qclass name (len)

h2opolo.1538 > helios.domain: 3+ A? ucbvax.berkeley.edu. (37)
A few anomalies are checked and may result in extra fields enclosed in square brackets: If a query contains an answer, authority records or additional records section, ancount, nscount, orarcount are printed as `[na]', `[nn]' or `[nau]' where n is the appropriate count. If any of the response bits are set (AA, RA or rcode) or any of the `must be zero' bits are set in bytes two and three, `[b2&3=x]' is printed, where x is the hex value of header bytes two and three.
UDP Name Server Responses
Name server responses are formatted as
src > dst:  id op rcode flags a/n/au type class data (len)

helios.domain > h2opolo.1538: 3 3/3/7 A 128.32.137.3 (273)
helios.domain > h2opolo.1537: 2 NXDomain* 0/1/0 (97)
In the second example, helios responds to query 2 with a response code of non-existent domain (NXDomain) with no answers, one name server and no authority records. The `*' indicates that the authoritative answer bit was set. Since there were no answers, no type, class or data were printed.
Other flag characters that might appear are `-' (recursion available, RA, not set) and `|' (truncated message, TC, set). If the `question' section doesn't contain exactly one entry, `[nq]' is printed.
SMB/CIFS decoding
tcpdump now includes fairly extensive SMB/CIFS/NBT decoding for data on UDP/137, UDP/138 and TCP/139. Some primitive decoding of IPX and NetBEUI SMB data is also done.
By default a fairly minimal decode is done, with a much more detailed decode done if -v is used. Be warned that with -v a single SMB packet may take up a page or more, so only use -v if you really want all the gory details.
For information on SMB packet formats and what all the fields mean see www.cifs.org or the pub/samba/specs/ directory on your favorite samba.org mirror site. The SMB patches were written by Andrew Tridgell (tridge@samba.org).
NFS Requests and Replies
Sun NFS (Network File System) requests and replies are printed as:
src.sport > dst.nfs: NFS request xid xid len op args
src.nfs > dst.dport: NFS reply xid xid reply stat len op results


sushi.1023 > wrl.nfs: NFS request xid 26377
        112 readlink fh 21,24/10.73165
wrl.nfs > sushi.1023: NFS reply xid 26377
        reply ok 40 readlink "../var"
sushi.1022 > wrl.nfs: NFS request xid 8219
        144 lookup fh 9,74/4096.6878 "xcolors"
wrl.nfs > sushi.1022: NFS reply xid 8219
        reply ok 128 lookup fh 9,74/4134.3150
In the third line, sushi asks (using a new transaction id) wrl to lookup the name `xcolors' in directory file 9,74/4096.6878. In the fourth line, wrl sends a reply with the respective transaction id.
Note that the data printed depends on the operation type. The format is intended to be self explanatory if read in conjunction with an NFS protocol spec. Also note that older versions of tcpdump printed NFS packets in a slightly different format: the transaction id (xid) would be printed instead of the non-NFS port number of the packet.
If the -v (verbose) flag is given, additional information is printed. For example:
sushi.1023 > wrl.nfs: NFS request xid 79658
        148 read fh 21,11/12.195 8192 bytes @ 24576
wrl.nfs > sushi.1023: NFS reply xid 79658
        reply ok 1472 read REG 100664 ids 417/0 sz 29388
If the -v flag is given more than once, even more details are printed.
Note that NFS requests are very large and much of the detail won't be printed unless snaplen is increased. Try using `-s 192' to watch NFS traffic.
NFS reply packets do not explicitly identify the RPC operation. Instead, tcpdump keeps track of ``recent'' requests, and matches them to the replies using the transaction ID. If a reply does not closely follow the corresponding request, it might not be parsable.
AFS Requests and Replies
Transarc AFS (Andrew File System) requests and replies are printed as:
src.sport > dst.dport: rx packet-type
src.sport > dst.dport: rx packet-type service call call-name args
src.sport > dst.dport: rx packet-type service reply call-name args


elvis.7001 > pike.afsfs:
        rx data fs call rename old fid 536876964/1/1 ".newsrc.new"
        new fid 536876964/1/1 ".newsrc"
pike.afsfs > elvis.7001: rx data fs reply rename
In general, all AFS RPCs are decoded at least by RPC call name. Most AFS RPCs have at least some of the arguments decoded (generally only the `interesting' arguments, for some definition of interesting).
The format is intended to be self-describing, but it will probably not be useful to people who are not familiar with the workings of AFS and RX.
If the -v (verbose) flag is given twice, acknowledgement packets and additional header information is printed, such as the RX call ID, call number, sequence number, serial number, and the RX packet flags.
If the -v flag is given twice, additional information is printed, such as the RX call ID, serial number, and the RX packet flags. The MTU negotiation information is also printed from RX ack packets.
If the -v flag is given three times, the security index and service id are printed.
Error codes are printed for abort packets, with the exception of Ubik beacon packets (because abort packets are used to signify a yes vote for the Ubik protocol).
Note that AFS requests are very large and many of the arguments won't be printed unless snaplen is increased. Try using `-s 256' to watch AFS traffic.
AFS reply packets do not explicitly identify the RPC operation. Instead, tcpdump keeps track of ``recent'' requests, and matches them to the replies using the call number and service ID. If a reply does not closely follow the corresponding request, it might not be parsable.
KIP AppleTalk (DDP in UDP)
AppleTalk DDP packets encapsulated in UDP datagrams are de-encapsulated and dumped as DDP packets (i.e., all the UDP header information is discarded). The file /etc/atalk.names is used to translate AppleTalk net and node numbers to names. Lines in this file have the form
number  name

1.254           ether
16.1            icsd-net
1.254.110       ace
AppleTalk addresses are printed in the form
net.host.port

144.1.209.2 > icsd-net.112.220
office.2 > icsd-net.112.220
jssmag.149.235 > icsd-net.2
NBP (name binding protocol) and ATP (AppleTalk transaction protocol) packets have their contents interpreted. Other protocols just dump the protocol name (or number if no name is registered for the protocol) and packet size.
NBP packets are formatted like the following examples:
icsd-net.112.220 > jssmag.2: nbp-lkup 190: "=:LaserWriter@*"
jssmag.209.2 > icsd-net.112.220: nbp-reply 190: "RM1140:LaserWriter@*" 250
techpit.2 > icsd-net.112.220: nbp-reply 190: "techpit:LaserWriter@*" 186
ATP packet formatting is demonstrated by the following example:
jssmag.209.165 > helios.132: atp-req  12266<0-7> 0xae030001
helios.132 > jssmag.209.165: atp-resp 12266:0 (512) 0xae040000
helios.132 > jssmag.209.165: atp-resp 12266:1 (512) 0xae040000
helios.132 > jssmag.209.165: atp-resp 12266:2 (512) 0xae040000
helios.132 > jssmag.209.165: atp-resp 12266:3 (512) 0xae040000
helios.132 > jssmag.209.165: atp-resp 12266:4 (512) 0xae040000
helios.132 > jssmag.209.165: atp-resp 12266:5 (512) 0xae040000
helios.132 > jssmag.209.165: atp-resp 12266:6 (512) 0xae040000
helios.132 > jssmag.209.165: atp-resp*12266:7 (512) 0xae040000
jssmag.209.165 > helios.132: atp-req  12266<3,5> 0xae030001
helios.132 > jssmag.209.165: atp-resp 12266:3 (512) 0xae040000
helios.132 > jssmag.209.165: atp-resp 12266:5 (512) 0xae040000
jssmag.209.165 > helios.132: atp-rel  12266<0-7> 0xae030001
jssmag.209.133 > helios.132: atp-req* 12267<0-7> 0xae030002
Helios responds with 8 512-byte packets. The `:digit' following the transaction id gives the packet sequence number in the transaction and the number in parens is the amount of data in the packet, excluding the atp header. The `*' on packet 7 indicates that the EOM bit was set.
Jssmag.209 then requests that packets 3 & 5 be retransmitted. Helios resends them then jssmag.209 releases the transaction. Finally, jssmag.209 initiates the next request. The `*' on the request indicates that XO (`exactly once') was not set.
IP Fragmentation
Fragmented Internet datagrams are printed as
(frag id:size@offset+)
(frag id:size@offset)
Id is the fragment id. Size is the fragment size (in bytes) excluding the IP header. Offset is this fragment's offset (in bytes) in the original datagram.
The fragment information is output for each fragment. The first fragment contains the higher level protocol header and the frag info is printed after the protocol info. Fragments after the first contain no higher level protocol header and the frag info is printed after the source and destination addresses. For example, here is part of an ftp from arizona.edu to lbl-rtsg.arpa over a CSNET connection that doesn't appear to handle 576 byte datagrams:
arizona.ftp-data > rtsg.1170: . 1024:1332(308) ack 1 win 4096 (frag 595a:328@0+)
arizona > rtsg: (frag 595a:204@328)
rtsg.1170 > arizona.ftp-data: . ack 1536 win 2560
A packet with the IP don't fragment flag is marked with a trailing (DF).
Timestamps
By default, all output lines are preceded by a timestamp. The timestamp is the current clock time in the form
hh:mm:ss.frac
SEE ALSO
stty(1), pcap(3PCAP), bpf(4), nit(4P), pcap-savefile(5), pcap-filter(7), pcap-tstamp(7)AUTHORS
The original authors are:Van Jacobson, Craig Leres and Steven McCanne, all of the Lawrence Berkeley National Laboratory, University of California, Berkeley, CA.
It is currently being maintained by tcpdump.org.
The current version is available via http:
The original distribution is available via anonymous ftp:
IPv6/IPsec support is added by WIDE/KAME project. This program uses Eric Young's SSLeay library, under specific configurations.
BUGS
Please send problems, bugs, questions, desirable enhancements, patches etc. to:NIT doesn't let you watch your own outbound traffic, BPF will. We recommend that you use the latter.
On Linux systems with 2.0[.x] kernels:
- packets on the loopback device will be seen twice;
- packet filtering cannot be done in the kernel, so that all packets must be copied from the kernel in order to be filtered in user mode;
- all of a packet, not just the part that's within the snapshot length, will be copied from the kernel (the 2.0[.x] packet capture mechanism, if asked to copy only part of a packet to userland, will not report the true length of the packet; this would cause most IP packets to get an error from tcpdump);
- capturing on some PPP devices won't work correctly.
Some attempt should be made to reassemble IP fragments or, at least to compute the right length for the higher level protocol.
Name server inverse queries are not dumped correctly: the (empty) question section is printed rather than real query in the answer section. Some believe that inverse queries are themselves a bug and prefer to fix the program generating them rather than tcpdump.
A packet trace that crosses a daylight savings time change will give skewed time stamps (the time change is ignored).
Filter expressions on fields other than those in Token Ring headers will not correctly handle source-routed Token Ring packets.
Filter expressions on fields other than those in 802.11 headers will not correctly handle 802.11 data packets with both To DS and From DS set.
ip6 proto should chase header chain, but at this moment it does not. ip6 protochain is supplied for this behavior.
Arithmetic expression against transport layer headers, like tcp[0], does not work against IPv6 packets. It only looks at IPv4 packets.
Index
- NAME
- SYNOPSIS
- DESCRIPTION
- OPTIONS
- EXAMPLES
- OUTPUT FORMAT
- SEE ALSO
- AUTHORS
- BUGS
Ref: http://www.tcpdump.org/tcpdump_man.html;
Ref: http://www.tecmint.com/12-tcpdump-commands-a-network-sniffer-tool/
Subscribe to:
Comments (Atom)